Breaking the illusion of a healthy inventory in ERP Ops.
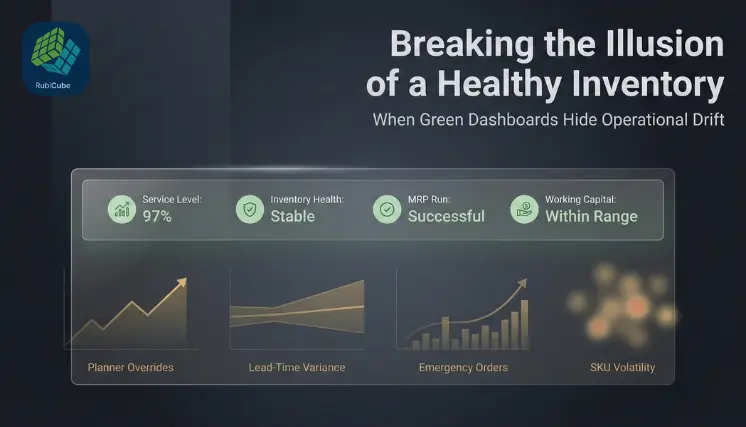
Inventory dashboards rarely trigger an alarm. Service levels appear stable.
Stock positions look adequate. MRP runs on schedule. Working capital ratios seem manageable.
“From an executive perspective, inventory appears to be under control.”
Yet beneath that surface, subtle distortions begin to accumulate, expediting frequency increases, planners override system suggestions, customer fill inconsistencies rise, and liquidity tightens without a clear root cause.
This is the illusion of healthy inventory.
In environments operating on systems such as Sage X3, Sage 300, or similar systems, the ERP is functioning as designed. It records transactions accurately, enforces structured process logic, and generates reports based on posted data.
The risk does not originate in system malfunction. It emerges when transactional accuracy is mistaken for operational health.
Inventory Stability vs. Inventory Intelligence:
Traditional inventory governance relies heavily on lagging indicators:
- Days Inventory Outstanding (DIO)
- Service level percentages
- Stock turns
- Carrying cost ratios
- Gross margin contribution
These metrics are necessary for control and reporting. However, they are not predictive. They confirm historical performance. They rarely illuminate emerging drift.
Operational deterioration does not begin as a KPI failure. It begins as a pattern anomaly in production and inventory management.
Below are the most common executive hallucinations that sustain the illusion of health.
1. The High Service-Level Illusion
Executive Assumption:
“Our service level is above 95%. We are performing well.”
Operational Reality:
Averages conceal concentration risk. A 95% service level can mask:
- Chronic stock-outs within high-margin or strategic SKUs
- Key customer dissatisfaction concentrated in specific regions
- Margin erosion caused by substitutions
- Escalating emergency freight costs
Aggregated performance metrics dilute localized risk signals. The ERP confirms compliance. The customer experiences inconsistency.
Strategic Consequence:
Leadership confidence remains high while commercial risk quietly compounds.
2. The Safety Stock Comfort Illusion
Executive Assumption:
“We increased safety stock to mitigate volatility. Risk is controlled.”
Operational Reality:
Safety stock often compensates for unaddressed variability rather than resolving it. Buffers tend to expand when:
- Supplier reliability is inconsistent
- Forecast bias is politically adjusted
- Lead times drift without recalibration
- Planners repeatedly override MRP outputs
Inventory levels rise. Liquidity declines. Underlying instability persists. The ERP reflects availability. The balance sheet reflects frozen capital.
Strategic Consequence:
Working capital efficiency deteriorates without an explicit operational crisis.
3. The MRP Optimization Illusion
Executive Assumption:
“Our MRP engine runs daily. Planning is optimized.”
Operational Reality:
MRP executes deterministic logic based on configured parameters.
If those parameters are outdated or misaligned:
- Forecast bias compounds over cycles
- Lead-time assumptions become stale
- Demand variability is underestimated
- Supplier performance remains unweighted
The engine executes consistently. The assumptions degrade gradually. Without dynamic recalibration, the system repeats yesterday’s logic in the face of tomorrow’s volatility.
Strategic Consequence:
Decision misalignment is system-approved, not system-detected.
4. The Growth-Justifies-Inventory Illusion
Executive Assumption:
“Revenue is increasing. Inventory growth is proportional.”
Operational Reality:
Inventory frequently grows faster than revenue in subtle ways.
Capital accumulates in:
- Slow-moving tail SKUs
- Low-margin items
- Seasonal inventory with optimistic forecasts
- Overestimated new product launches
Revenue may grow 8%. Inventory may grow 20%. The delta represents decision latency, not strategic investment.
Strategic Consequence:
Return on Capital Employed (ROCE) declines while headline growth obscures capital inefficiency.
5. The ERP-as-Truth Illusion
Executive Assumption:
“If it is in the ERP, it reflects operational reality.”
Operational Reality:
ERP systems reflect recorded events — not developing risk.
Phantom availability emerges when:
- Warehouse updates lag
- Returns remain classified as saleable
- Inter-warehouse transfers misalign
- Shrinkage is not reconciled in real time
The system reports availability. The physical floor contradicts it. The gap rarely appears in executive dashboards. It surfaces as operational friction.
Strategic Consequence:
Sales–Operations tension increases. Customer confidence erodes. Leadership trust in data declines.
Why These Illusions Persist:
These distortions endure because:
- Executive dashboards prioritize summary metrics over signal detection
- ERP architectures are designed for transaction integrity, not pattern recognition
- Lagging KPIs delay visibility of emerging volatility
- Decision latency remains unmeasured
Inventory deterioration is rarely abrupt. It is statistical, incremental, and initially non-disruptive. Until capital tightens, service destabilizes, and recovery becomes routine in the real-time inventory management operations.
At that point, responses are reactive:
- Increase buffers
- Expedite shipments
- Tighten controls.
- Reduce discretionary spending.
Reaction, however, is not intelligence.
What mid-market enterprises increasingly require are not more dashboards but a decision intelligence layer above ERP. This is the role of #RubiCube.
RubiCube does not replace ERP systems. It augments them. Where ERP records transactions, RubiCube analyzes formation. Where ERP confirms compliance, RubiCube detects deviation.
How RubiCube Reframes Inventory Governance in ERP:
RubiCube focuses on structural signals such as:
- SKU-level volatility clustering
- Vendor reliability scoring and heatmaps
- Inventory concentration risk exposure
- Safety-stock distortion indicators
- Revenue-to-inventory divergence
- Decision latency measurement
Where ERP shows “stock on hand,” RubiCube quantifies “risk forming.” Where ERP shows “service level achieved,” RubiCube evaluates concentration fragility. Where ERP shows “MRP executed,” RubiCube surfaces parameter drift probability. In short, RubiCube is ERP decision intelligence for Inventory and beyond.
This represents a shift from retrospective reporting to proactive intervention.
If inventory appears stable yet liquidity feels constrained, if service metrics remain strong yet customer friction rises, if planning overrides are increasing without formal acknowledgment, the issue may not be inventory. It may be decision visibility.
RubiCube functions as the decision intelligence layer above your ERP, not just as an inventory analytics platform, detecting operational drift before it distorts capital, service, and strategic confidence.
To request a private inventory diagnostic and assess hidden risk formation within your operations, contact sales@rubicube.ai